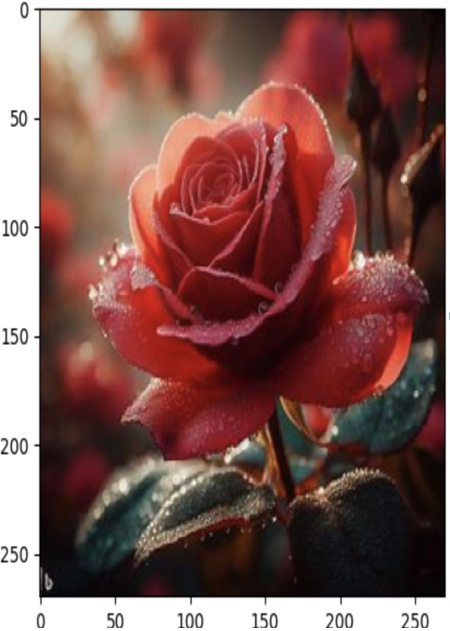
Let’s see an example of visualizing image data using Matplotlib. In the following code, we first load the image using the PIL library:
import matplotlib.pyplot as plt
import numpy as np
from PIL import Image
# Load an image
img = Image.open(‘../images/roseflower.jpeg’)
Then we convert it to a NumPy array using the np.array function:
# Convert image to numpy array
img_array = np.array(img)
Next, plot the result with the following commands:
# Plot the image
plt.imshow(img_array)
plt.show()
We get the following result:

Figure 4.1 – Visualizing image data
We then use the imshow function from Matplotlib to plot the image. Converting images to NumPy arrays during EDA offers several benefits that make data manipulation, analysis, and visualization more convenient and efficient. NumPy is a powerful numerical computing library in Python that provides support for multi-dimensional arrays and a wide range of mathematical operations. Converting images to NumPy arrays is common during EDA as NumPy arrays provide direct access to individual pixels in an image, making it easier to analyze pixel values and perform pixel-level operations. Many data analysis and visualization libraries in Python, including Matplotlib and scikit-learn, work seamlessly with NumPy arrays. This allows you to take advantage of a rich ecosystem of tools and techniques for image analysis.
There are many different ways to visualize image data using Matplotlib. We’ll now review a few commonly encountered examples.
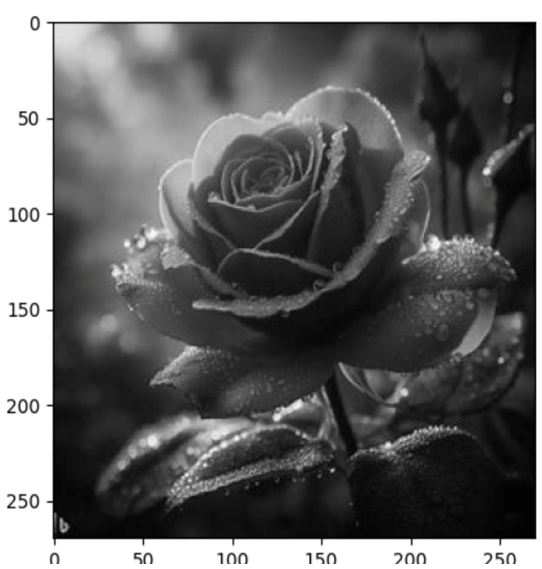
Grayscale image: To display a grayscale image, we can simply set the cmap parameter of the imshow function to ‘gray’:
import numpy as np
from PIL import Image
import matplotlib.pyplot as plt
img_color = Image.open(‘../images/roseflower.jpeg’)
# Convert the image to grayscale
img_gray = img_color.convert(‘L’)
# Convert the image to a NumPy array
img_gray_array = np.array(img_gray)
# Display the image using matplotlib
plt.imshow(img_gray_array, cmap=’gray’)
# Show the plot
plt.show()
The following figure is the result of this code:

Figure 4.2 – Grayscale image
Histogram of pixel values: We can use a histogram to visualize the distribution of pixel values in an image. This can help us understand the overall brightness and contrast of the image:
import numpy as np
from PIL import Image
import matplotlib.pyplot as plt
# Load an image
img_color = Image.open(‘../images/roseflower.jpeg’)
# Convert image to numpy array
img_array = np.array(img_color)
# Plot the histogram
plt.hist(img_array.ravel(), bins=256)
plt.show()
